GPT Image 2 infographics: tell the whole data story in one image
GPT Image 2's most underrated ability is making infographics. Its Chinese character rendering is 10x more reliable than Midjourney's; feed it data plus structure and it produces an infographic ready for an annual report, a deck, or LinkedIn.
一張 1:1 的資訊圖表設計:

主題:[主題 — 例如「2026 年台灣 AI 產業就業分布」]

核心數據(必須 1:1 精準呈現,不可改動):
- [數字 1][單位]:[標籤 1]
- [數字 2][單位]:[標籤 2]
- [數字 3][單位]:[標籤 3]

視覺結構:
- 左上角:主標題(22-28 字),粗黑體 sans-serif
- 中央:主圖形(長條圖 / 圓形圖 / 樹狀圖 擇一)
- 四角:四個數據 call-out 方框,每個框內有 1 個大數字 + 1 行說明文字
- 底部:一行資料來源(12pt,灰色)

排版規則:
- 字體:Noto Sans TC + Inter(中英搭配)
- 主標題 40pt、次級 18pt、說明 12pt
- 顏色:米白背景 #f5f2ec + 朱紅 #c23a30 主色 + 墨黑 #121212 文字
- 無 emoji、無裝飾插圖、無漸層、無陰影

設計風格:日式工業型錄 + 瑞士排版。每一個元素都該可測量可對齊、網格清晰。像是印在白色 paper 上的政府統計圖,但現代版本。

Reference: 日經新聞年報 infographic, Information is Beautiful 簡潔版本。

Avoid: emojis 任何地方、3D 圖形、水彩插圖、卡通角色、漸變背景、rainbow 色、花體字、手寫字。
Swap the variables inside the [ ] brackets for your own content, then paste into GPT Image 2.
No other tool needed — run this prompt right here and see the result (edit the text and swap the [variables] first if you like). History lives in My generations.
GPT Image 2's command of structured layout plus precise text is the best of any current image model. This prompt breaks an infographic into four layers, main headline, data points, visual structure, and layout rules, so what you feed in comes back out as a finished asset ready to drop into a LinkedIn post, a corporate annual report, or an IPO deck.
一張 1024×1024 資訊圖表:米白背景、主標題「2026 台灣 AI 產業就業分布」用粗黑體放左上;中央是一個簡潔的水平長條圖,四個數據 call-out 分佈在四個角落 — 「47%:軟體工程師」「22%:資料科學家」「18%:產品經理」「13%:研究與學術」;底部一行小字標註資料來源(104 人力銀行 2026 Q1)。中文不亂碼、對齊精準、沒有任何裝飾噪音,直接能截圖貼 LinkedIn。
A description of the intended result. Check this entry's testing notes and try the prompt with your own inputs.
[主題]越具體越好。「2026 台灣 AI 就業」比「AI 趨勢」穩定 5 倍
[數據點]3-4 個就夠。多了 GPT Image 2 會壓縮字體導致可讀性下降
[資料來源]寫實際來源(104、主計處、Gartner)增加專業感
填下面的欄位,上方 prompt 會即時替換 [方括號] 內容。填好後按「複製組好的 prompt」直接丟進工具。
一張 1:1 的資訊圖表設計:

主題:[主題 — 例如「2026 年台灣 AI 產業就業分布」]

核心數據(必須 1:1 精準呈現,不可改動):
- [數字 1][單位]:[標籤 1]
- [數字 2][單位]:[標籤 2]
- [數字 3][單位]:[標籤 3]

視覺結構:
- 左上角:主標題(22-28 字),粗黑體 sans-serif
- 中央:主圖形(長條圖 / 圓形圖 / 樹狀圖 擇一)
- 四角:四個數據 call-out 方框,每個框內有 1 個大數字 + 1 行說明文字
- 底部:一行資料來源(12pt,灰色)

排版規則:
- 字體:Noto Sans TC + Inter(中英搭配)
- 主標題 40pt、次級 18pt、說明 12pt
- 顏色:米白背景 #f5f2ec + 朱紅 #c23a30 主色 + 墨黑 #121212 文字
- 無 emoji、無裝飾插圖、無漸層、無陰影

設計風格:日式工業型錄 + 瑞士排版。每一個元素都該可測量可對齊、網格清晰。像是印在白色 paper 上的政府統計圖,但現代版本。

Reference: 日經新聞年報 infographic, Information is Beautiful 簡潔版本。

Avoid: emojis 任何地方、3D 圖形、水彩插圖、卡通角色、漸變背景、rainbow 色、花體字、手寫字。
 PRO01
PRO01Premium 3D Collectible Figure Avatar
Transform the input photo into a high-end stylized 3D collectible figure…
 PRO02
PRO02Cherry Blossom Café Outdoor Portrait
Edit the provided image while preserving the same face identity, shape,…
 PRO03
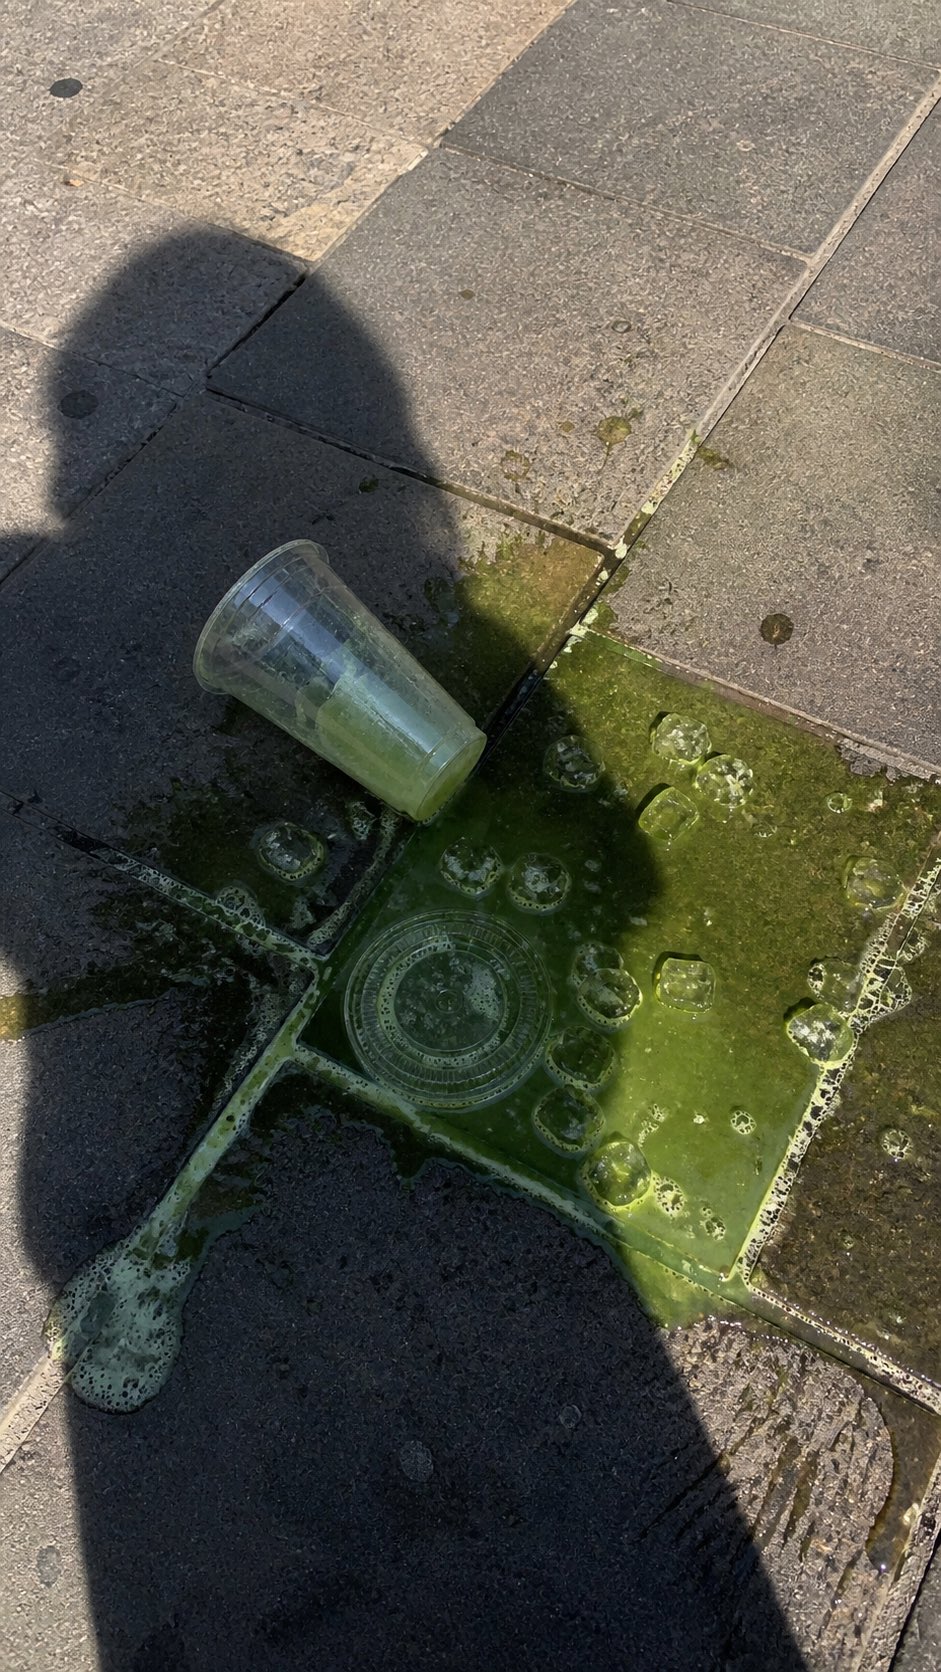
PRO03Spilled Matcha Street Smartphone Photo
A realistic vertical smartphone photo of a spilled green iced drink on o…
 PRO04
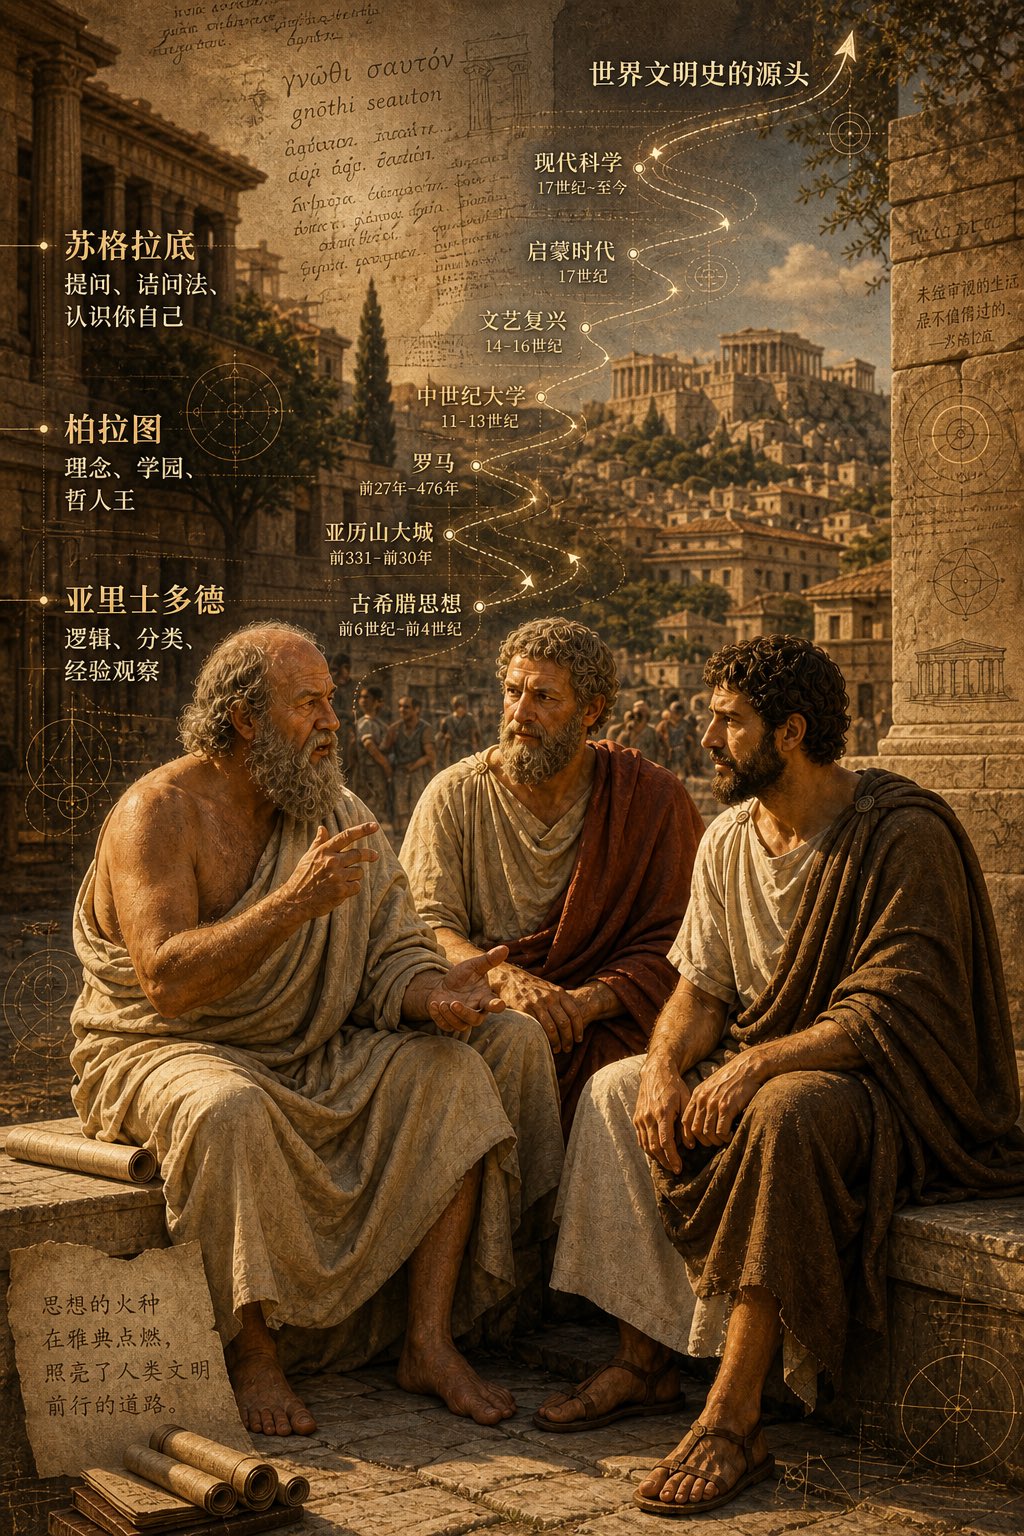
PRO04Three Ancient Greek Philosophers Timeline City Map
Two and a half thousand years ago, Plato, Socrates, and Aristotle sat talking on the streets of Athens, and that conversation gave rise to the origins of world civilization. In the background, their conversation can be added, following the timeline, overlaid onto ancient Gree…