← INDEX / Tags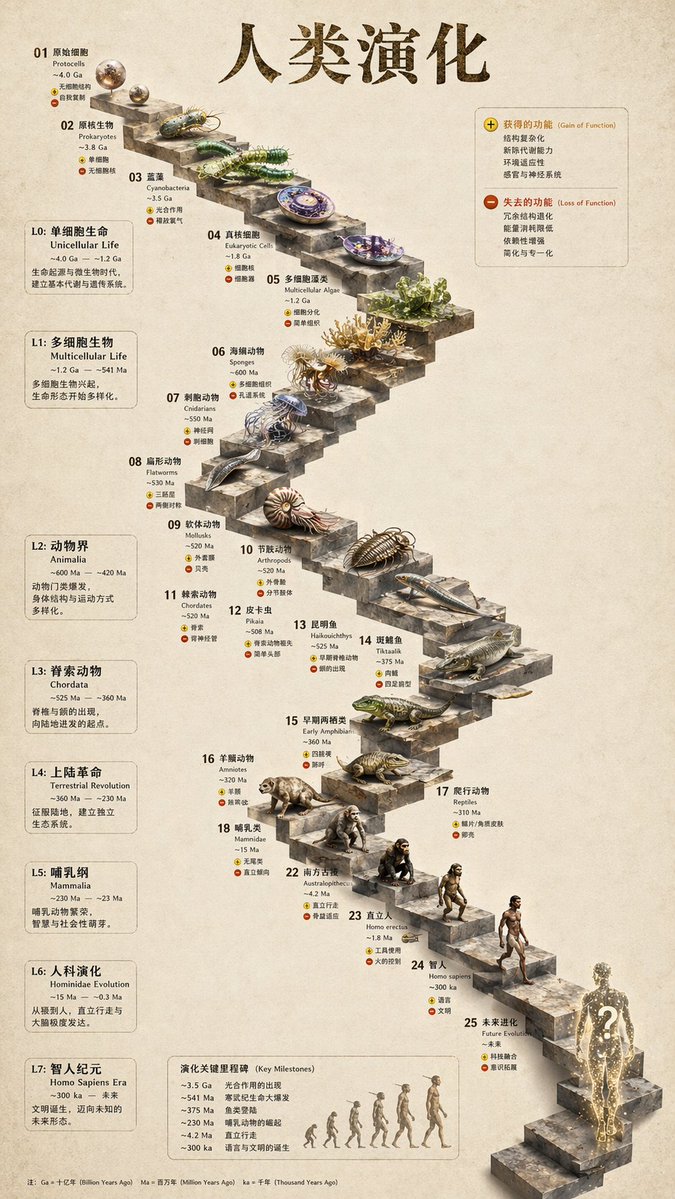 PRO49
 PRO50
 PRO51
 PRO52
TAG · 52 prompts
#圖表與資訊視覺化
Explore public prompts for 圖表與資訊視覺化. Narrow the topic by medium or change the order.
Showing 49–52 of 52 · Page 3 / 3
PRO49IMAGEGPT Image 2
2026-06-26
Infographic Visualization Design
{ "type": "evolutionary timeline infographic", "instruction": "Using R…
AdvancedGen in-site
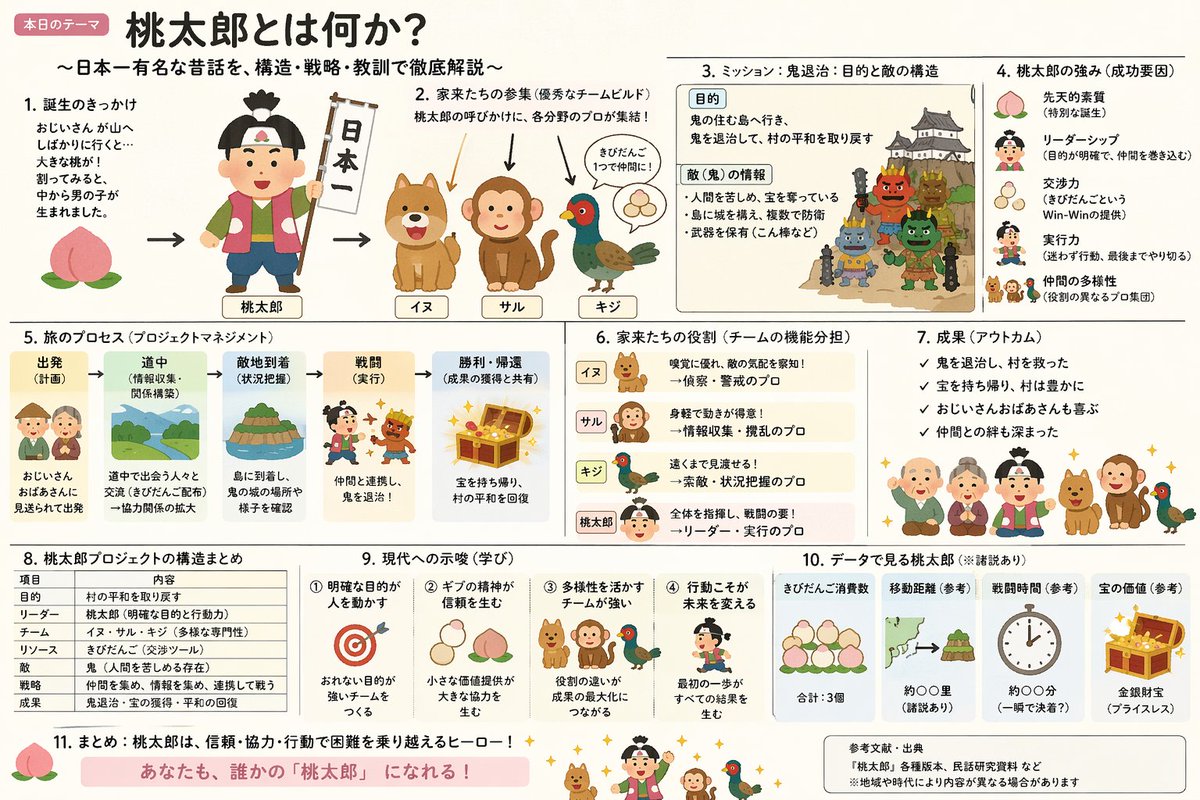
PRO50IMAGEGPT Image 2
2026-06-26
Infographic Visualization Design
Create an explanatory slide, with the diagram format set via an argument (default: ponchi-e diagram style)...
IntermediateGen in-site
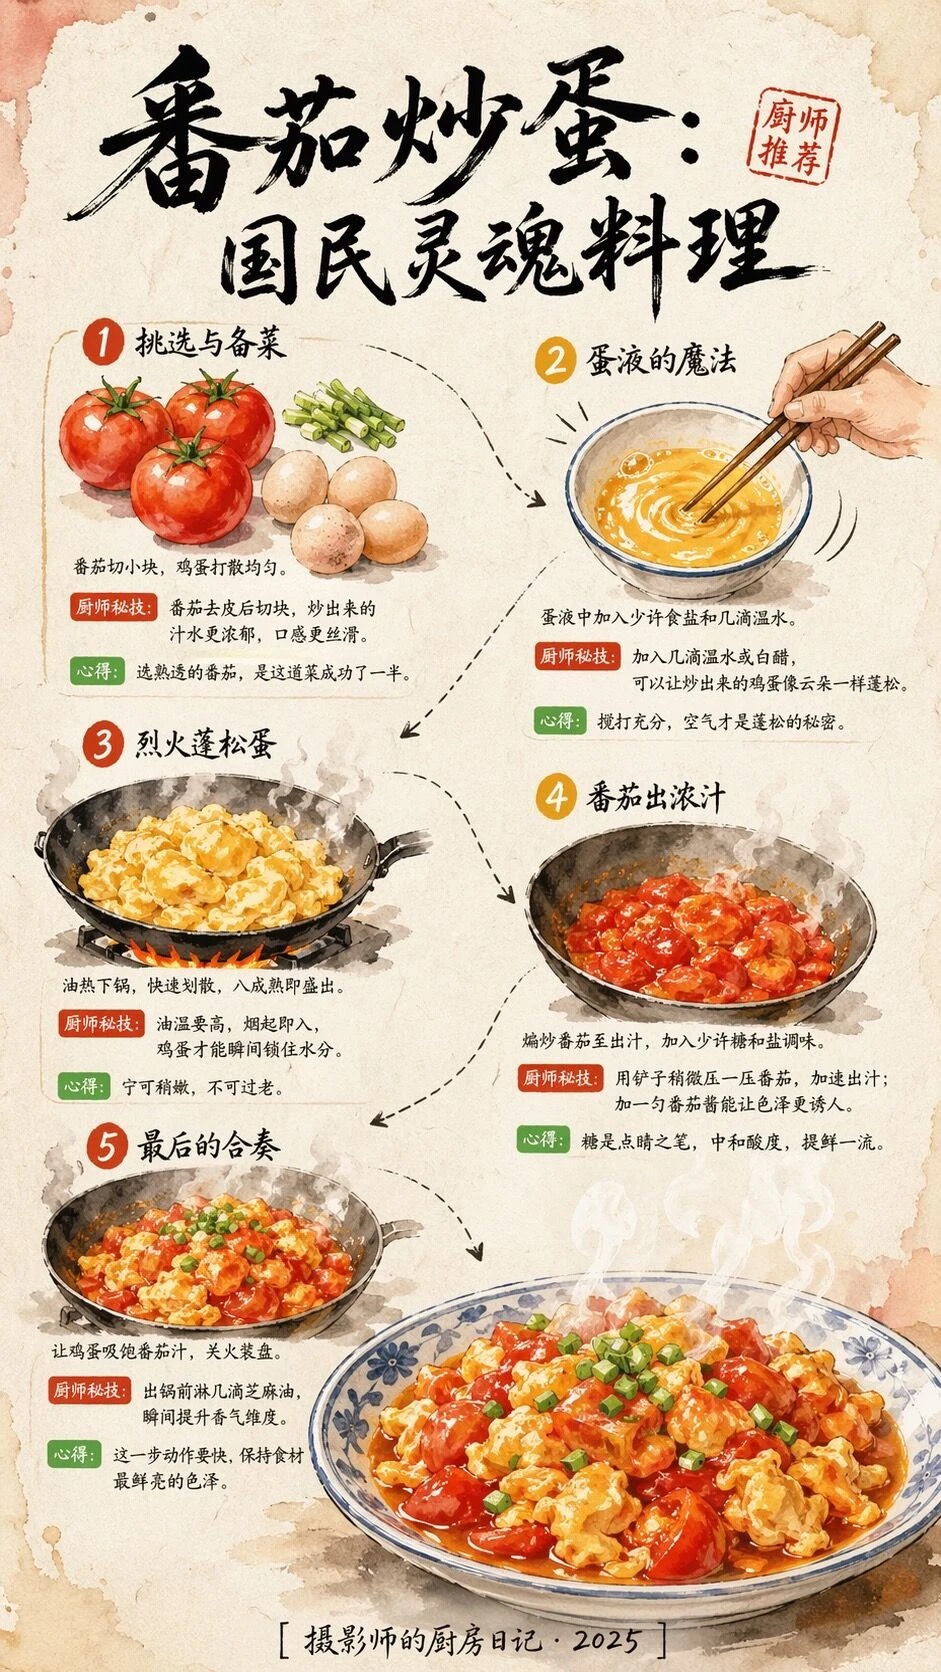
PRO51IMAGEGPT Image 2
2026-06-26
Infographic Visualization Design
Visual design spec: 9:16 aspect ratio (vertical mobile infographic); background texture is a breathable beige handmade washi paper with subtle fiber grain…
AdvancedGen in-site
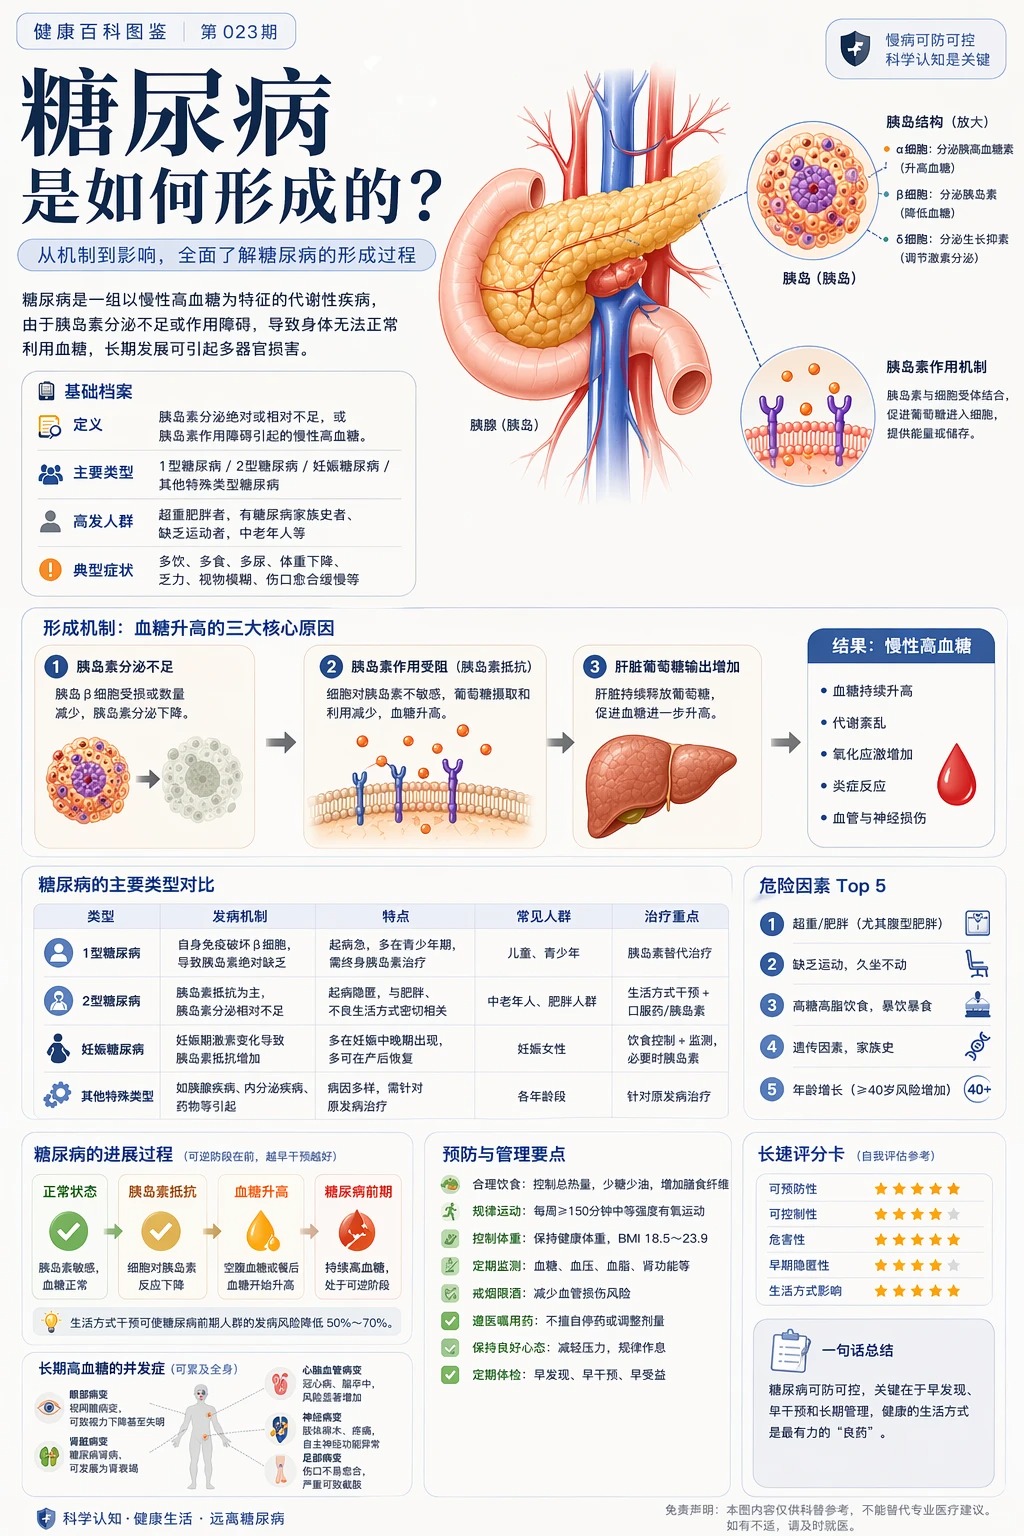
PRO52IMAGEGPT Image 2
2026-06-26
Science Encyclopedia Illustration
Based on [Topic], generate a high-quality vertical "Science Encyclopedia Illustration." This image is not an ordinary poster, nor a simple illustration, but a modular science visual that combines the feel of a field guide, an encyclopedia, structured information, and a collectible…
IntermediateGen in-site